Capability Map
810 lines — 35+ screens, 10 DB tables, 3 integrations — Thu, Dec 18, 2025
Admin Interview
137 lines — 5 pain points, 9 recommendations, 7 domains proposed — Wed, Mar 11, 2026
Redesign Plan
532 lines — two parallel workstreams defined — Wed, Mar 11, 2026
Framework Analysis
WS1 — 6 frameworks analyzed, 6 workflows mapped (1,931 lines) — Wed, Mar 11, 2026
Candidate Specification
WS1 — 3 eliminated, 3 hybrid candidates specified (935 lines) — Wed, Mar 11, 2026
Candidate Evaluation
WS1 — Enhanced Candidate A wins 30/35 (526 lines) — Wed, Mar 11, 2026
Billing Discovery
WS2 — 5 repos audited, 6 workarounds mapped, 6 screens defined (1,489 lines) — Wed, Mar 11, 2026
Complete Specification
48 screens across 9 domains, 11 spec files (~4,300 lines) — Wed, Mar 11, 2026
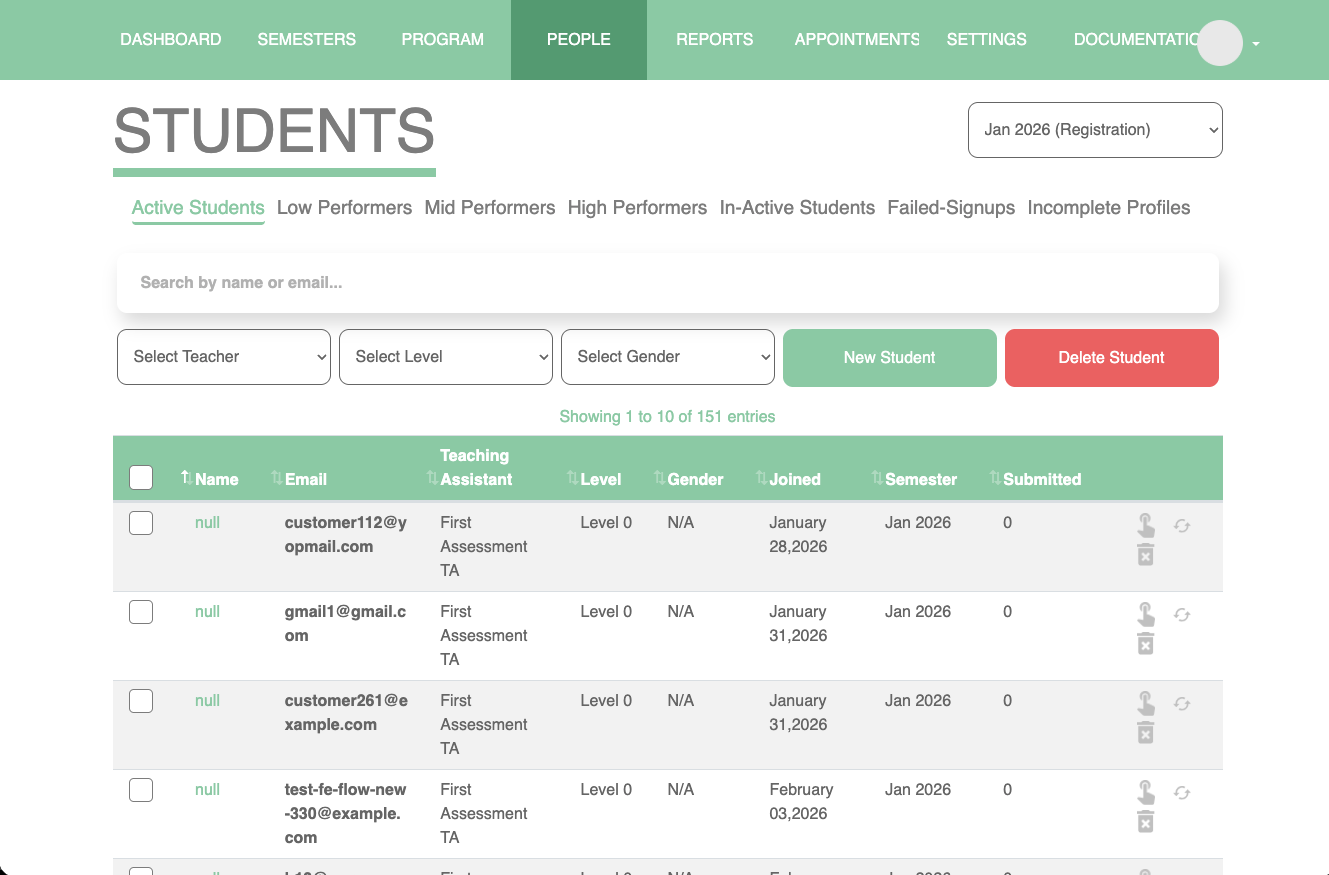
Admin Mockup
59 components, 35 routes, 13 build phases, 52 deviations found — Wed–Thu, Mar 11–12, 2026
Mock Data Audit
54 submissions added, 20 student stories, 9 cross-reference rules — Sat, Mar 29, 2026
Gap Analysis + Pre-Meeting Framework
9 per-domain gap analyses + 5-category risk framework — Tue, Apr 14, 2026
Stakeholder Review Meeting
90 min with Lejla — 11 decisions, 5 ADRs, Framework v2, revised 12-file spec — Wed, Apr 15, 2026
Lejla's Written Reply
5-step End Checklist canonical; 11/13 defaults confirmed, 2 flipped — Tue, Apr 21, 2026
Working Session
60 min — Reporting, Issue Queue, Repeat Semester resolved; ADR-006 added; ADR-002 amended — Wed, Apr 22, 2026
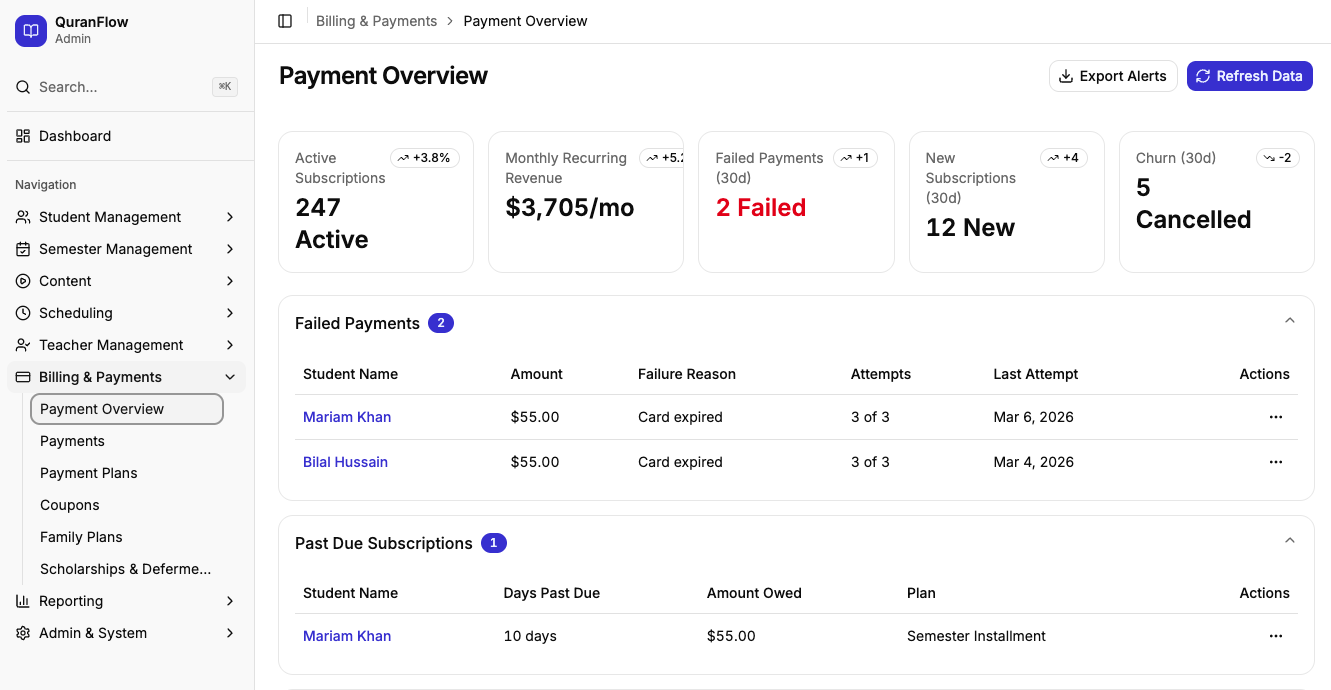
v2 Mockup Build
43 screens across 9+1 domains, 8 phases (A–H), ~36 hours, v1 untouched — Wed–Thu, Apr 22–23, 2026
v2 Audit + Polish Pass
21+ fixes — semantic-token sweep, EST timezone, audit BLOCKERs, ADR-006 cleanup — Sun–Tue, May 3–5, 2026
May 5 Granjur Walkthrough
First mockup walkthrough with Granjur engineering — Mon, May 5, 2026
Impact Map + Architecture Evaluation
100% transcript read + 4 parallel domain gap-analyses; engineer's 5-question response (HTML for stakeholders) — Tue–Wed, May 5–6, 2026
Q2 Content Shape — Round 2 Decision
Granjur's Option D counter-proposal evaluated; schema §2.4 rewrite + cover email to team — Fri–Sun, May 8–10, 2026
Lejla Domain 1–4 Feedback Applied
Backend supplementary feedback (domains 1–3) evaluated and shipped into v2.1 mockup — Sun, May 10, 2026
Tag-as-Saved-Filter Prototype
ADR-007 prototype branch — saved audience tags, multi-select filters, audit-trail discipline — Wed, May 13, 2026
May 14 Scheduling Walkthrough
Granjur Pt. 2 — 6 scheduling decisions (S1–S6), 7 enrollment types, Zoom integration scoped — Thu, May 14, 2026
Pre-Review Pipeline
4-phase agentic kanban across 5 remaining v2 domains — 71 files audited, decision packages + punch lists — Thu, May 15, 2026
Phase D Mockup Sprint
~50 commits in one day — T/C/SF/A/B/D/X codes across teacher-mgmt, comm, reporting, admin-system + raw-label sweep — Thu, May 15, 2026
Phase D /simplify + Bindings Pass
Net −419 lines across 4 domains; screen-data-bindings ripple; team-update HTML — Fri, May 15–16, 2026
Billing Resolutions
45 decisions resolved internally + 12 mockup items shipped + 4-item stakeholder ratification doc — Sun, May 17, 2026
Post-Phase-D 21-Cycle Loop
11 ADRs landed (10 new + ADR-007 final), 3 Granjur handover packets (51 OQ-IDs / 45 items), 4-auditor final integration audit (104 findings, 10 BLOCKERs fixed) — Sun–Mon, May 17–18, 2026
Production Week-0 Pre-Flight Checklist
1,186 lines, 344 addressable items across 12 phases + 3 appendices — Mon, May 18, 2026
Loop-Completion Team Update + Merge
v2.1/phase-d → main; loop-completion HTML with end-to-end ADR trace + glossary + 5-layer stack — Mon–Tue, May 18–19, 2026
May 20 Meeting Asks
5 standalone open questions (L1, L2, U1, U2, U3) with recommended defaults, extracted as standalone team-update page — Wed, May 20, 2026
Architecture ADR-001 Accepted
DigitalOcean App Platform (nyc) selected over Render/Railway/Fly on lowest-vendor-risk branch; C2 Neon-à-la-carte stack locked — Mon, May 25, 2026
Granjur Option E Schema Evaluation
Holidays Option B proposal + schema Option E comparative + complete DBML + visualisation + Option E recommendation — Mon–Tue, May 25–26, 2026
Production Handover Bundle
quranflow-admin repo bootstrapped — scaffold, 18 ADRs, 4-contract docs, onboarding mini-site, 30-min walkthrough HTML — Mon, May 25, 2026
Issue-Routing System
4 GitHub issue templates + interactive /file-issue skill + handover-bundle polish for Granjur — Tue, May 26, 2026
Each step's output became the next step's input. Every decision was driven by evidence — workflow data, interview findings, scored evaluations, stakeholder quotes — not intuition. The process produced 50+ source documents across two cycles, all linked above.
The durable artifacts for anyone picking this up next — the contractor who will build against v2, a colleague joining the project, a future reviewer — are: the Framework v2 decision catalog, the six ADRs, the 12-file v2 admin spec, and the live v2 mockup. Everything else on this page traces how those four artifacts got to their current shape.